Confining NGINX
Posted: 2025-05-19

Securing NGINX on Kubernetes: A Deep Dive into Security Context
This post is about securing one of the best web servers out there: NGINX. When running NGINX on Kubernetes, security is of paramount importance. Today, we’ll dive into one of the key controls of containerized security: the securityContext in your Kubernetes resources, and explore how it helps build a hardened deployment.
A Look at the Helm Configuration Template
Let’s kick things off by examining the Helm template for our NGINX deployment:
podSecurityContext:
  fsGroup: 2000

securityContext:
  capabilities:
    drop:
    - ALL
    add:
      - NET_BIND_SERVICE
      - CHOWN
      - SETGID
      - SETUID
  allowPrivilegeEscalation: true
  readOnlyRootFilesystem: true
At first glance, it might seem a bit scary that the security context allows for privilege escalation with allowPrivilegeEscalation: true. However, understanding this configuration in context reveals a carefully balanced trade-off between functionality and security.
Understanding the Security Context
Pod-Level Security: podSecurityContext
At the pod level, specifying fsGroup: 2000 ensures that all containers in the pod share the same file system group. This setting is particularly important when working with shared storage. By standardizing group permissions, you properly manage file access on mounted volumes and reduce the risk of unauthorized modifications. It’s a simple way to maintain consistency and trust across various containers running within a single pod.
Container-Level Security Details
The container-level securityContext offers a finer granularity of control:
Capabilities Management:
Drop All Capabilities: By default, containers may inherit a broad set of Linux capabilities. Dropping them all (
drop: [ALL]) minimizes the potential attack surface.Selective Addition: The configuration then selectively adds back only the capabilities explicitly needed:
NET_BIND_SERVICE: Allows NGINX to bind to well-known ports (below 1024) such as port 80 or 443.CHOWN,SETGID, andSETUID: These ensure that NGINX has the appropriate privileges to change file ownerships and user identities where necessary, which is especially useful in secure environments where the process might need to drop root privileges after it starts.
Privilege Escalation:
- The
allowPrivilegeEscalation: truesetting might raise eyebrows. Why permit escalation if we are locking down capabilities? In certain environments, especially when binding to privileged ports or performing specific system calls, temporary elevation can be required. The NGINX underneath the hood launches a separate highly restricted process.
- The
Read-Only Filesystem:
- Setting
readOnlyRootFilesystem: trueis a robust security measure. It prevents any accidental or malicious modifications to the container’s root filesystem, effectively reducing the risk of persistent tampering should an attacker gain access.
- Setting
This granular approach means that while the container might be allowed a controlled privilege escalation for specific tasks, its overall access is heavily restricted, and any potential modifications to the root filesystem are curtailed.
Trade-offs and Best Practices
Balancing Security and Functionality
It is crucial to evaluate the needs of your application carefully. While allowing privilege escalation (allowPrivilegeEscalation: true) may seem counterintuitive for a hardened security profile, there are valid reasons for the setting in an environment like NGINX:
Binding to Privileged Ports: NGINX typically needs to listen on ports 80 (HTTP) and 443 (HTTPS). Binding to these ports without the right privileges would require a container to escalate privileges at least momentarily. By explicitly adding the
NET_BIND_SERVICEcapability, you provide this functionality without opening up the container to a broad set of privileges.Controlled Environment: With the rest of the security context in place (dropping all unnecessary capabilities, setting the filesystem to read-only), the risk associated with allowing privilege escalation is minimized. It’s about striking the perfect balance—enabling necessary operations without compromising the overall security posture.
Further Enhancements
Regular Audits and Monitoring: Security is not a one-time configuration. Ensure that your NGINX deployment, along with all associated containers, is subject to regular security audits. Utilize Kubernetes audit logging and monitoring to capture anomalies in container behavior.
Pod Security Policies and OPA: Consider implementing Pod Security Policies (or their newer replacements in modern Kubernetes versions) or Open Policy Agent for fine-grained control over pod specifications. This adds another layer of defense by enforcing standardized security baselines across your cluster.
Image Scanning and Vulnerability Management: Always use up-to-date container images and integrate continuous vulnerability scanning into your CI/CD pipeline. Even the most hardened configurations can be compromised by outdated components.
Zero Trust and Network Policies: Remember, securing the container is only part of the equation. Use Kubernetes Network Policies to restrict traffic between pods, and implement a zero-trust network model that further isolates your NGINX server from potential attackers.
Wrapping Up
Securing NGINX on Kubernetes isn’t about eliminating every risk—it’s about managing them intelligently. By leveraging Kubernetes’ robust security contexts, you ensure that your NGINX deployment has minimal privileges, only the necessary capabilities, and a read-only filesystem to protect it from unauthorized modifications.
Each configuration decision, like allowing privilege escalation, should be made with a full understanding of the functionality it enables and the potential risks it introduces. Combined with best practices in monitoring, image management, and network isolation, this approach lays a strong foundation for a secure, high-performance NGINX deployment.
How to make money in Natural Gas with Python
Posted: 2024-01-25

In one of the previous posts, we were talking about simple gas storage model as a business opportunity. That model has one serious drawback: it does not take injection and withdrawal ratchets.
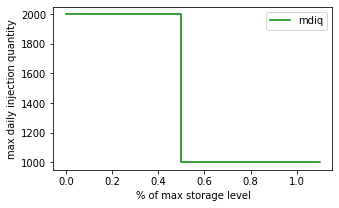
An inventory ratchet means different maximum daily injection or withdrawal quantity depending on the amount of gas in storage. The picture below shows injection ratchets as a function of storage level.
Previous excel model has limited features and also Excel’s solver convergence is not great. Industry use requires a model that would closely mimic reality which means a need to use nonlinear functions in constraint definition. On the top of that, the problem is a Mixed Integer Programming which forces to use specialized solvers.
One of them with a decent quality is CBC solver from fantastic COIN-OR project. We’re going to sprinkle the model with a bit of Python and bake it in Jupyter to get this notebook.
There are some interesting results. When injection ratchet is constant at 2000 Dth per day, the storage peaks 100,000 in 2nd and 3rd month. Additionally, withdrawal strategy is trying to monetize small peak during summer demand for cooling power.

Not much change when the ratchet is reduced to 1000 Dth.

However, ratchet reduction by 75% at half storage shows rather dramatic injection profile. This time storage peaks roughly in 6th month.

This model is still very basic because it skips discounting and costs. Nonetheless, ability to specify fairly complex constraints, combined with python and MIP solvers allow for very powerful scenario analysis.
There is one more draw back of the model. It does not take volatility into account, but this is a material for the next post.
Image by Kevin Schneider from Pixabay
Machine learning with Python and C#
Posted: 2024-01-12

This post is about practical challenges with data science.
At Process IQ we like Python and friends. It is a great language: it is expressive, easy to read and comes with fantastic set of libraries. However there are two things which are thorny with Python: deployments and no type safety.
This is our opinion - we are a small and agile tech company and we like efficiency that comes with type safety. Nonetheless, there are large companies, running Python applications at big scale e.g. Instagram, Google and YouTube, Dropbox or PayPal.
One activity where we use Python in production is machine learning, or rather machine “teaching”. Our data science team likes to use Python environment to experiment with models, and train them. However for production use we require models to be executed directly through the .NET runtime for security and stability reasons.
We also like Gradient Boosting Models for their expressiveness and efficiency with respect to required number of data samples. So here is a practical problem: how can you transfer a model from Python environment into .NET runtime?
Turns out that Microsoft has been pushing successfully ML.NET libraries which also ship with Onnx model format. Onnxmltools are able to translate industry standard sci-kit models so .NET can execute them directly. Here’s how:
import onnxmltools
from onnxmltools.convert.common.data_types import FloatTensorType

sci_kit_model = ...

onnx_model = onnxmltools.convert_lightgbm( sci_kit_model, initial_types=[('input', FloatTensorType([1,2]))] )
onnxmltools.utils.save_model(onnx_model, 'onnx.model')
The following code fragment shows how to use onnx model in C#.
private class TestData
{
    [VectorType(2)]
    public float[] input;
}

public class TestOutput
{
    [ColumnName("label")]
    [VectorType(1)]
    public long[] Label { get; set; }
}

static void Main(string[] args)
{
    var mlContext = new MLContext();
    var data = mlContext.Data.LoadFromEnumerable( new TestData[] {});

    var onnxPredictionPipeline = mlContext.Transforms
        .ApplyOnnxModel("onnx.model");

    var transformer = onnxPredictionPipeline.Fit(data);
    var onnxPredictionEngine = mlContext.Model.CreatePredictionEngine<TestData, TestOutput>(transformer);

    var prediction = onnxPredictionEngine.Predict(new TestData { input = new float[] { 0f, 0f } });
    Console.WriteLine($"label: {string.Join(",", prediction.Label)}");
}
Pretty easy 😎. Our corporate cat is shocked!

Photo by Ariana Suárez on Unsplash
Testing Service Workers with Puppeteer
Posted: 2024-01-06

Warning: Technical content inside 😉
Service Worker is a JavaScript that your browser runs in the background. It is not part of the web page, rather it allows to add additional features like push notifications or background synchronization.
Browser enforces very strong security mechanism around service worker: - script can only be started from a https or localhost urls - no code can be injected from web page - service worker is not allowed to access DOM directly - service worker can communicate with web pages it controls by responding to messages sent via postMessage api
Protections around code injection makes testing of service workers complicated, however Puppeteer is a tool that can help with that. Puppeteer communicates with Chrome browser via Chrome DevTools Protocol - CDP. This means we have access to networking events.
The easy way with setRequestInterception unfortunately does not work reliably with service workers. They operate in a different target context so we need to use CDP directly.
The following code snippet shows how to do this:
const browser = await puppeteer.launch()
const page = await browser.newPage()
await page.goto('https://example.com')

browser.on('targetcreated', async (target) => {
    const client = await target.createCDPSession()
    await client.send('Network.enable')
    client.on('Network.requestWillBeSent', params => {
        console.log( 'target: ', target.name, 'params: ', params)
    }
}
We register a callback which puppeteer will call when a new target is created (example: a new page or new service worker). Then we register another callback on CDP client with method Network.requestWillBeSent which allows us to inspect traffic from Service Worker and perform necessary testing activities.
Hurray! We have achieved state of inception: a callback in a callback aka callback-hell.
Photo by pixpoetry on Unsplash
Turbocharging Excel
Posted: 2023-12-17

Aka: Fast data retrieval from a database.
In a lot of enterprises that Process IQ had a pleasure to work with, there is always an Excel spreadsheet that implements a certain business process. One of the more painful aspects of Excel is how the data is getting there. There are few ways: - Manual data entry (🤷 although it can be pretty easy especially with built-in data validation) - Linking a worksheet to another worksheet on the shared drive (👎 ugly, evil and hideous) - Pulling the data from a database (👍👊👊)
We are big fans of bringing in the data via a database query. This helps to maintain data quality, perform audits or other regulatory reporting and later restructure the process to use more streamlined UIs or even move the process / application to the cloud.
There are few ways to query the database from Excel, but the one that is fairly fast is to use WorkbookQuery. The code below shows how to do it from a VBA level, which allows for additional parametrization of SQL.
WorkbookQuery is a relatively cheap trick that can help to restructure spreadsheets that may contain even few hundred thousand records (yes we have seen such monsters 🤕). And the nice thing is reduction of data load times. With cloud-hosted database, loading 100,000 records takes only 15 seconds now - way faster than opening the spreadsheet from a slow remote drive.
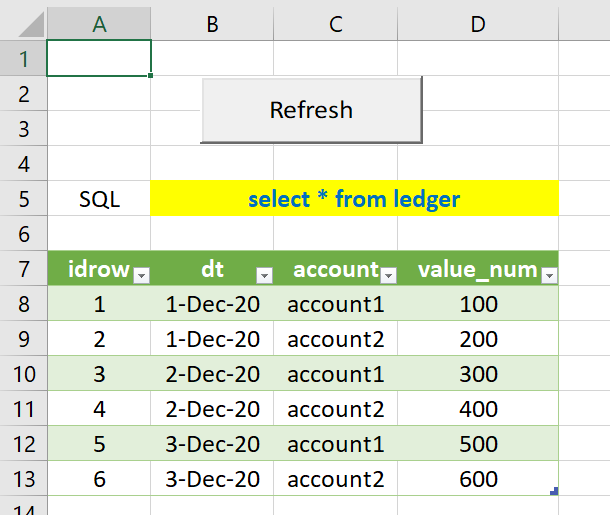
Here is VBA for those who are interested in
Private Sub btnRefresh_Click()
On Error GoTo ErrorHandler

    Dim wq = Me.Parent.Queries("Query1")
    wq.Formula = "let Source = Odbc.Query(""dsn=" & dsn & """, """ & sql & """) in Source"

    Dim conn As WorkbookConnection
    Set conn = lo.QueryTable.WorkbookConnection
    lo.QueryTable.BackgroundQuery = False
    conn.Refresh

    Exit Sub

ErrorHandler:
    MsgBox Err.Description + " at " + Err.Source, Error.vbExclamation
End Sub
Image by Herbert Aust from Pixabay
Faking It At Work: Testing with Javascript and Faker
Posted: 2023-12-10

As known as: Generating test data.
Here at Process IQ we are obsessed with automated testing to ensure our customers get top notch products and service. We do all of them: unit testing, integration testing, regression testing and performance testing. Some times we even test our test tools to ensure that they are good at testing (whew! that was a mouthful).
One of the challenges in modern software business is getting a sensible test data. This is especially important for performance testing where data needs to be generated in order to saturate the system to ensure it works well under normal conditions.
One of the techniques we like is to use Faker.js. This is a Node/Javascript package which simplifies creating meaningful names and content. Code for this post is on our Github repo.
The essential part of the code is below. It consist effectively of four parts: open connection to Postgresql, create table, generate data and perform insert. Final names actually look pretty good.
    // create client
    const client = new PG.Client({ connectionString: process.env.DB_CONNECTION_STRING })

    // connect
    await client.connect()

    // create table
    await client.query(sql)

    // generate data
    const arr = _.range(numRecords).map(i => {
        const rc = faker.helpers.createCard()
        return {
            name: rc.company.name,
            business: rc.company.bs,
            phone: rc.phone,
            address: rc.address.streetA + ', ' + rc.address.streetB + ', ' + rc.address.zipcode + ' ' + rc.address.city + ', ' + rc.address.county
        }
    }).map(x => [x.name, x.business, x.phone, x.address])

    // perform insert
    const insertSql = format('insert into counterparties( name, business, phone, address) values %L returning id', arr)
    const res = await client.query(insertSql)
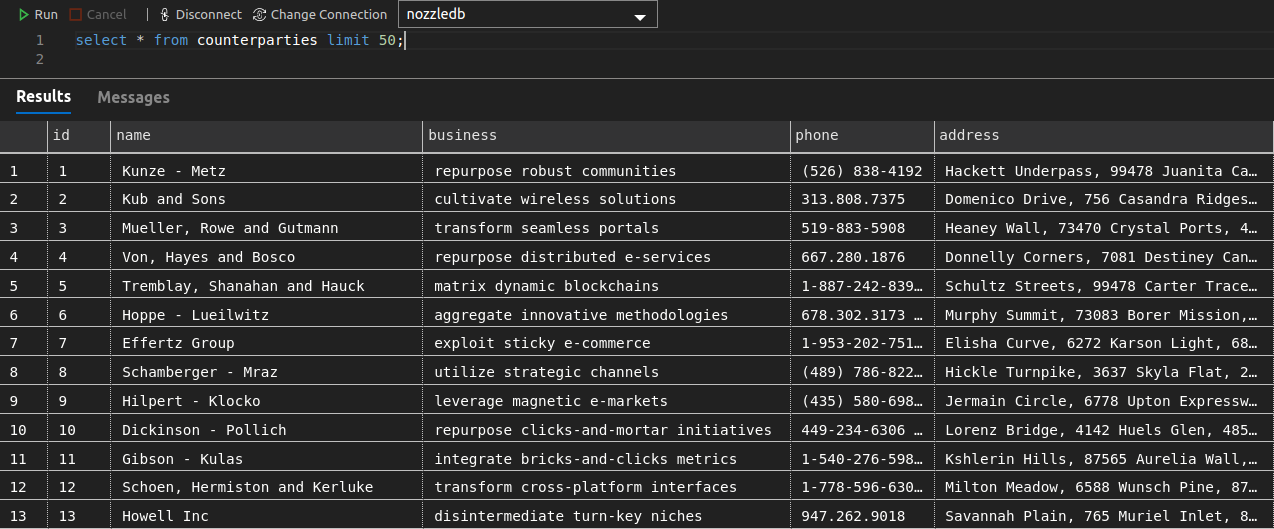
Photo by Sergey Semin on Unsplash
Seasons Greetings from us
Posted: 2023-11-25

Scenario analysis for Natural Gas options
Posted: 2023-11-12

Using Excel for decision making again!
When trading or pricing options, there is always a dilemma what would be best structure for given assumed market scenario. Here are some of the choices: - type of structure: put, call, calendar spread, fence, collar, condor, 1x2, etc - strike - maturity - entry / exit slippage - execution and brokerage costs
A seasoned investor would have a good intuitive approach which structure would create most of opportunities with minimal risk, but how do you gain such knowledge?
One way to do it is to use Excel and Data Table functionality for scenario analysis. Data Table can easily run 2 dimensional scenarios which are the most common for options: What would be the option price for a given futures price and time to expiry.
In this post we’re going to analyse a simple Natural Gas Call against January 2021 contract. We’re using Black model, however the Data Table also works for advanced models. As usual, Excel worksheet is here.
The following picture shows option pricer parameters. Additionally there is a matrix showing option prices for given market move on given day.
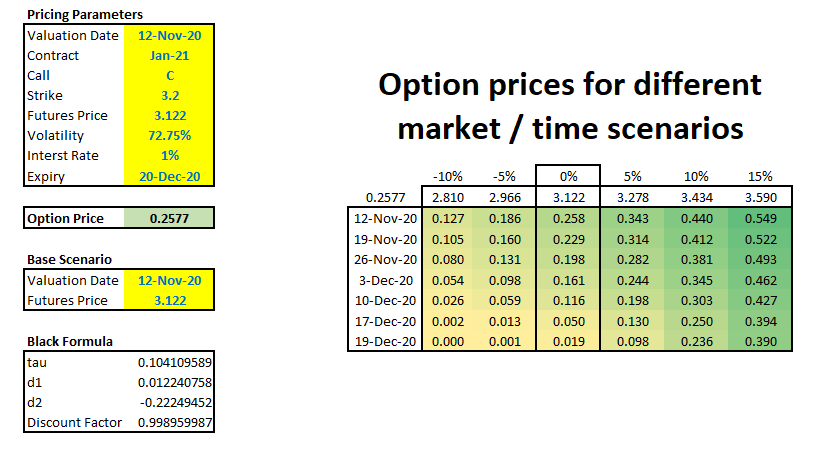
As the time progresses our call option looses time value, however if market goes up we can see sudden value increases. For example if we bought this option on 19 Dec 2020 (a day before expiry) for USD 0.019, a 5% move up in the market would value this option at USD 0.098 - an increase of more than 5 times! This is a phenomenal leverage, but trade-off is that our investment would be worthless next day.
Here’s the chart showing how time value decays as time progresses for different scenarios. For out of the money options as they are nearer the expiry their value becomes 0. On the other hand, the in the money options converge to their intrinsic value.
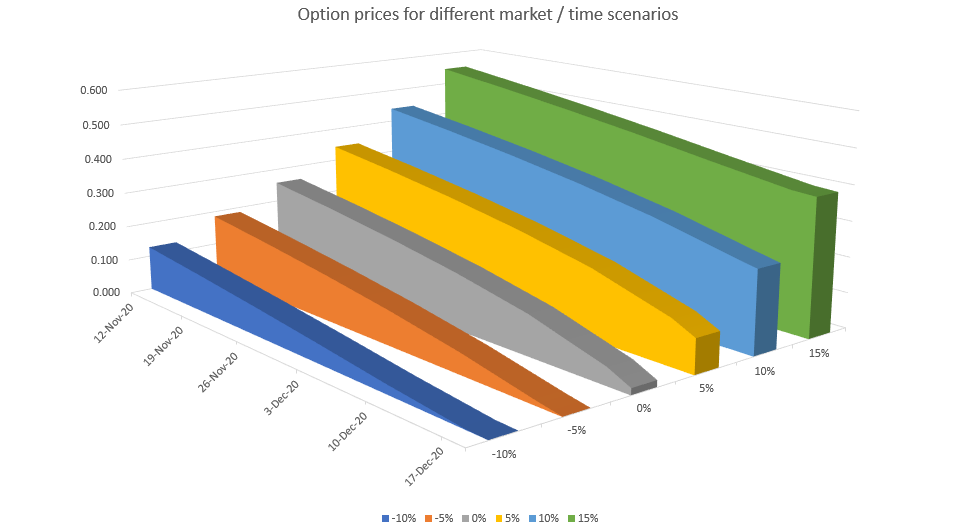
Photo by Alexander Schimmeck on Unsplash
How to make your boss happy
Posted: 2023-11-05

By speeding up that boring reconciliation with Excel.
A very frequent activity in any business is checking if an invoice, order list or any other data sets are correct. This is one of our obsessions here at Process IQ and we do this very frequently. One way to do it is to manually go through each item and check whether they match. The other way is to use a bit of automation. Excel is perfect if dataset is relatively small and the task is ad-hoc. In this post we are going to talk about two-way reconciliation. Unlike an SQL database where such two-way rec is called full outer join, the Excel doesn’t have a native function therefore we will use what’s available. As usual, Excel worksheet is here.
The setup
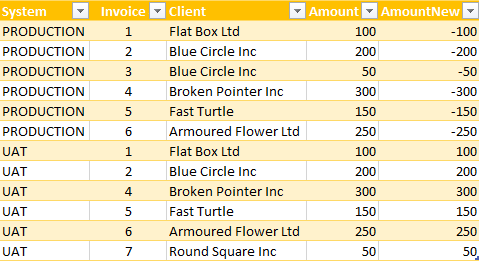
We are going to compare two systems PRODUCTION and UAT if generated invoices are matching. Here’s the example datasets, which is only few rows for the sake of simplicity.

This is a very small datasets and we can see that invoice 3 is missing in UAT. Additionally, UAT has invoice 7 which is not present in PRODUCTION system.
So, here’s the trick - we’re going to use Pivot table. Let’s combine these two tables to make one big table with additional attribute where the data is coming from. The PRODUCTION amounts will have to be negated which are in column AmountNew
Once the data is combined, we can then run a Pivot table with Data being Sum of AmountNew and Rows mapped to Client column. Here’s how it looks like

We can clearly see that invoices from Blue Circle and Round Square have differences between two systems in questions. Additionally, second pivot reconcilies invoices by id.
Finally Excel pivot table has a nice feature to drill into cell content. Clicking on Blue Circle will show composition of data from two systems.

Photo by Cookie the Pom on Unsplash
Taking chances in Monte Carlo
Posted: 2023-10-29

One of the cool ways to learn few tricks with Excel is to use it as a Monte-Carlo simulator to price options. For simple options like the ones traded against Nymex Henry Hub futures, there are closed form formulas available, however where’s fun there?
Basic Monte Carlo algorithm is actually quite simple: - we are going to throw a computer dice using Excel function Rand, this way we get a number from 0 to 1. This will be our “probability” - then we will use function Norm.s.inv to convert this probability into a draw from a normal distribution - next we calculate futures price at option expiry using this formula
$$ P = P_0 \cdot e^{( \frac {-\sigma^2 \cdot \tau} 2 + \sigma \sqrt \tau {dw})} $$ , where: $P_0$ is current futures price, $\sigma$ is volatility, $\tau$ is time fraction i.e. $\frac {expiry - today} {365}$, and $dw$ is normal draw from above
All the parameters required to price options are conveniently specified in worksheet’s panel. Details, as usual, in the attached Excel spreadsheet.
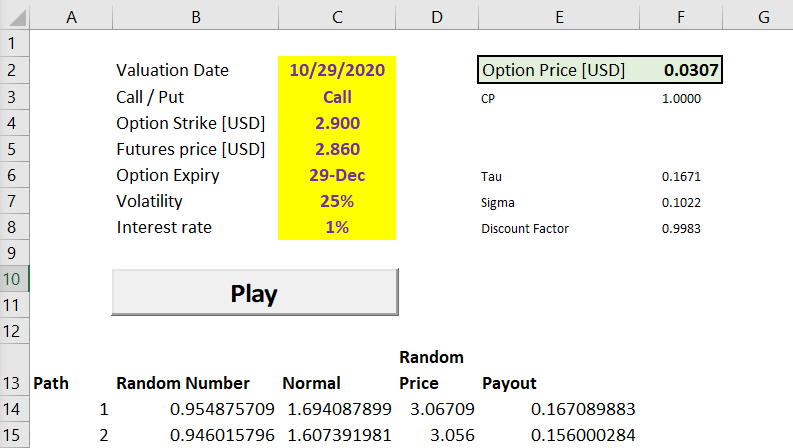
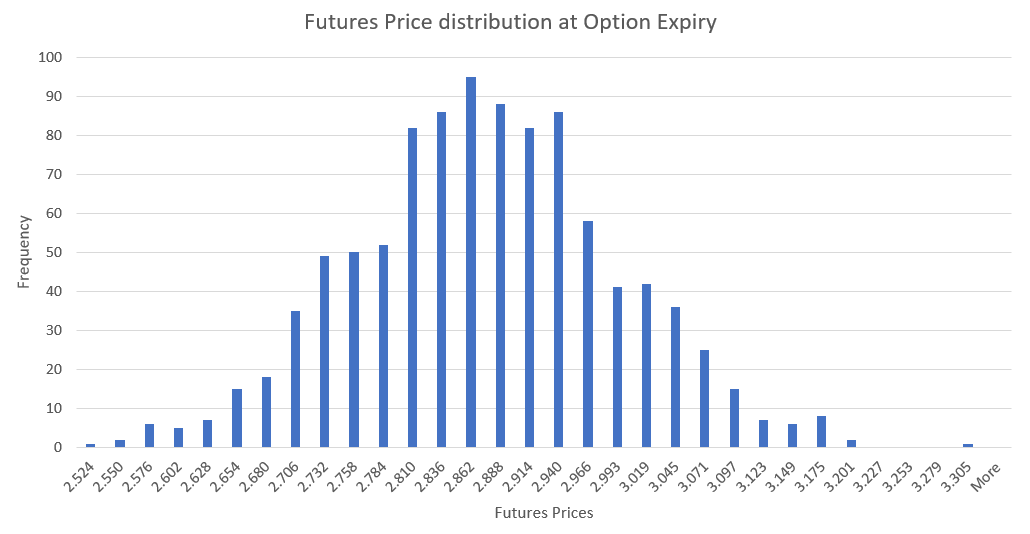
To finally calculate option fair value price, all we have to do is to average simulated option payouts. This chart shows distribution of generated futures prices.
Pricing exchange traded options using Monte Carlo is an over-kill, however Excel worksheets can be used to generate required scenarios to price more complicated instruments like storage contracts or transport rights. Stay tuned.
Photo by Heather Gill on Unsplash
Help! My python code is slow
Posted: 2023-10-22

TLDR: List comprehension is faster then append
Ok, so this isn’t a picture of a python snake (this is a boa constrictor), but it is the same story with append vs yield: they both kind of work in the same manner.
Most popular patterns in Python to create a list of widgets, can be summarised into these two categories: - for loop and then append on the list:
    l = []
    for x in sequence:
        y = do_something( x )
        l.append( y )
list comprehension with generator expresion
def gen( sequence ):
    for x in sequence:
        yield do_something( x )

l = [ x for x in gen( sequence ) ]
What is interesting however is that list comprehension is much faster. Here’s the chart to show to ilustrate the performance of these two solutions
– insert chart of both – tested with python 3.6 and cpu
def do_something( x ):
	return x

def m1(sequence):
	l = []
	for x in sequence:
		y = do_something( x )
		l.append( y )

def gen( sequence ):
	for x in sequence:
		yield do_something( x )

def m2(sequence):
    l = [ x for x in gen( sequence ) ]


sizes = [ 1000, 10000, 100000, 1000000, 10000000, 100000000 ]


def iter(arr):
	for s in sizes:
		seq = range(s)
		r1 = %timeit -o m1(seq)
		r2 = %timeit -o m2(seq)

		yield (s, r1, r2)

results = [ i for i in iter(sizes) ]

import matplotlib.pyplot as plt

x = sizes
y1 = [ i[1].average for i in results]
y2 = [ i[2].average for i in results]
plt.loglog( x, y1, x, y2 )
Photo by David Clode on Unsplash
How to make money in Natural Gas with Excel
Posted: 2023-10-20

One of the strategies is to buy cheap summer gas, store it for few months, and sell as expensive winter gas. Easily said than done. But how much should you pay for the storage facility and how to hedge the risk?
In this post we are going to review a simple gas storage model with static replication. This is an educational exercise and it is designed for simplicity.
Natural Gas storage is a critical function that operators use to balance the demand and supply especially during summer / winter seasons. Historically the heating demand for Natural Gas during winter is much higher than summer power burn and industrial demand which is reflected in the gas forward curve.

As mentioned earlier, winter Natural Gas demand is typically higher than available supply hence winter prices are also typically higher than summer prices. Gas storage owners use this phenomenon to buy “cheap” gas during summer months and sell during more expensive winter months.
Let us look at a simple storage model with 1y firm contract with no ratchets, no injection, draw and financing costs and no bid-offer or locational spreads. The hedge will follow static replication method, which means we are not taking volatility into consideration just price levels.
To solve optimization problem, we need to first define a target function. We are going to maximize revenue by buying gas and selling it later. The schedule will be subject to constraints: - maximum storage level cannot be greater than 100,000 dekatherms - maximum daily injection rate cannot be greater than 2,000 dekatherms - maximum daily withdrawal rate cannot be greater than 4,000 dekatherms
This formula describes our target function: $$ \max \sum Q{ij}(P{j}-P{i}) $$ , where: $Q{ij}$ means we are buying $Q$ dekatherms in month $i$, keeping it in storage and selling the same amount in month $j$. $P{i}$ and $P{j}$ are respective purchase and sell prices.
We are going to skip constraints for brevity, the target formula and constraints are implemented in attached Excel sheet.
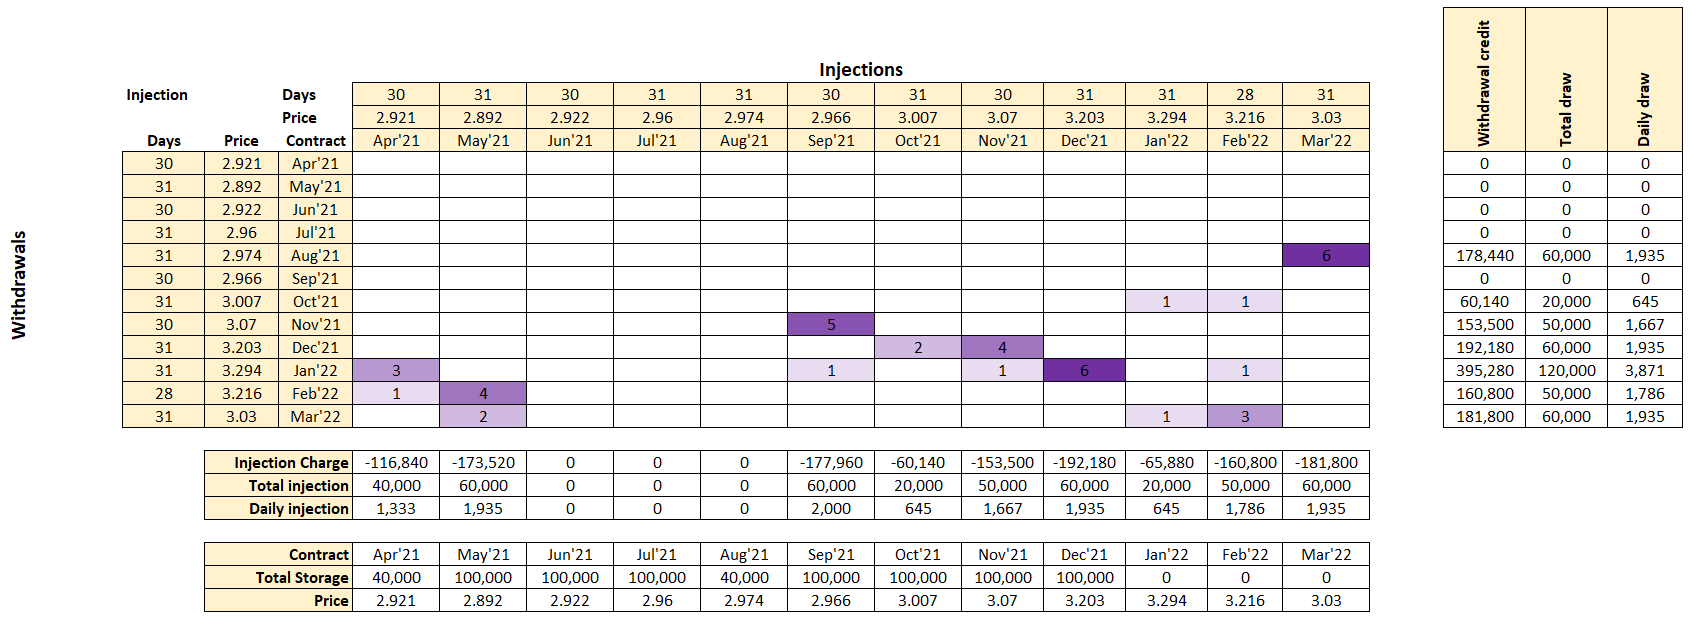
Using Excel solver shows that we can make revenue of USD 39,520 so if storage costs less than that we can make some profit.
Here is calculated hedging plan. For example, we need to buy 3 April’21 contracts at price 2.921 and sell 3 Jan’22 contracts at price 3.294 to hedge the P&L.
This chart shows amount of gas in storage for calculated plan vs the forward prices. The solver did an excellent job and constrained maximum storage level to 100,000 as was required.
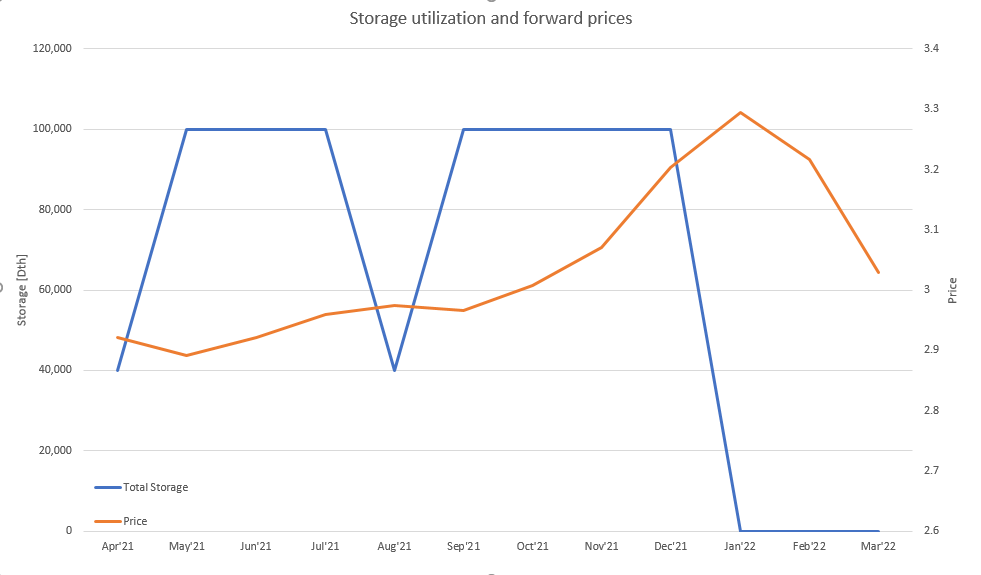
Photo by Josh Appel on Unsplash
Help! My Excel is too slow
Posted: 2023-10-14

Quick tip for those who suffer with slow Excel syndrome (SES). The main culprit are typically too much data and large number of volatile functions. We can talk how to solve too much data in Excel the other day, but let’s take a look at volatile functions first.
These functions are considered volatile: - NOW() - TODAY() - OFFSET() - INDIRECT() - VLOOKUP() - HLOOKUP() - RAND() - RANDBETWEEN()
In case a worksheet has a deep calculation tree (for example a cell containing value from Today() function is input directly or indirectly to other cells) then any change on the worksheet will force Excel to rerun all calculations.
The solution to this problem is to replace Today with TodayNV. Here’s the VBA:
Public Function TodayNV()
Begin
	Application.Volatile False
    TodayNV = Today
End
This way TodayNV will not be calculated during every change, however in order to recalculate the cell containing TodayNV run either Ctrl+Alt+F9 (full worksheet recalculation) or press F2 and then Enter on that cell.
Other trick, especially when spreadsheet is heavily dependant on Vlookup or Hlookup functions is to replace them with combination of Match and Index. Here is an example:
Vlookup example:

Match and Index example:

Photo by Krzysztof Niewolny on Unsplash
AI: No more dumb systems!
Posted: 2023-10-06
Almost everybody in professional setting has come to a brick wall caused by a computer system. Either it is a problem with a cumbersome data entry or a difficulty to trouble-shoot a record or trade in an ever increasing world of regulations or other complexities. The users frustration start building up, to the degree that they stop using the system! We’ve seen in our experience such actions, which derailed multi-million dollar investments led by established management consulting companies.
At Process IQ we solve those challenges by using Artificial Intelligence (sometimes called Machine Learning). Our mission is to enable our clients to focus on what they do the best: business. The boring stuff can be left to algorithms.
The typical process of rectifying a data problem at a financial organization quite often looks like this:
With AI we can simplify that:
The black box typically contains logistic regression or random forest ensemble, but the key is the feedback loop. By capturing good decisions and all bad, that the approver had to correct, the system learns from mistakes.
All those links are great, but how does it work in laymans terms? During learning process we are tweaking black box parameters to match what Approver selected. The parameters that give answers that are closest to the correct, are then used to provide recommendations. This is called supervised learning
At some point the science turns into art. How do you represent domain knowledge? What about curse of dimensionality? How to prevent over-fitting and how to optimize target function, are some of the questions that system designer is facing with. We strive for these challenges and our product CORTEX uses AI to reduce the boring stuff. So you can focus on more value add to the business.
A little bit of Excel Automation
Posted: 2023-10-05
Excel applications are the good, the bad and the ugly of trading or logistics process. Spreadsheets are great as a simple database with couple of formulas to act as a business logic, however what happens when a spreadsheet becomes integral part of the business process?
There is a reason for this and this reason is either to support a new business initiative or to implement workaround due to an existing system deficiency. The situation becomes very ugly very quickly. The new process means copying and pasting data into Excel and then copying and pasting into Outlook to communicate it to another group. Some of the copy and paste errors we have seen in our career were counted into hundreds of thousands of dollars.
There are couple of tricks that can help to fortify Excel worksheets:
- Lock the cells, such as only few input cells are editable
- No overriding of formulas. For example, two trades are represented as two separate records rather than a single record with additional formula for combined quantity
- Control sums with conditional formatting if values are outside of tolerance. For example, a scheduling spreadsheet can show supply and market for trades and storage and conditional formatting can flash warning in case of imbalance
- Our favorite: Adding a bit of VBA to send an email via Outlook just by pressing a button
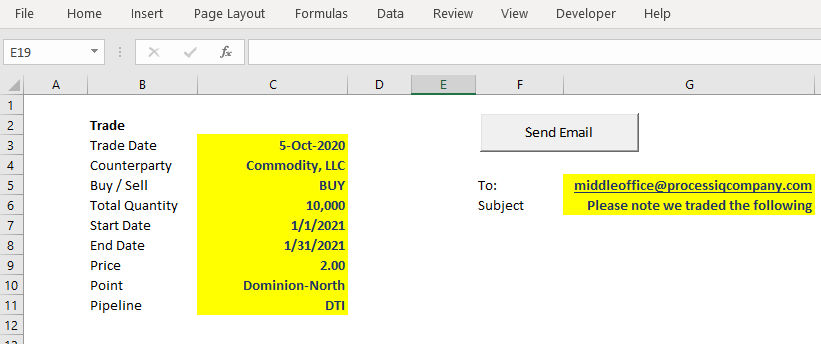
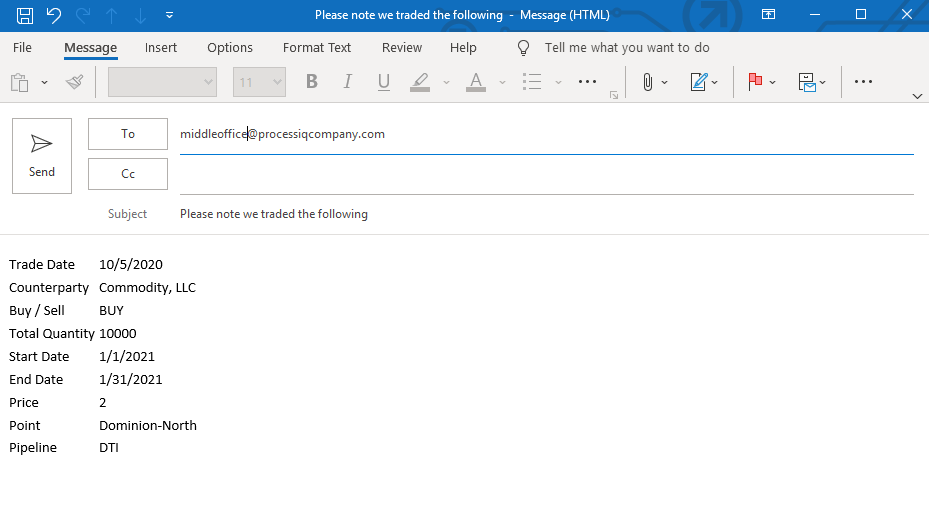
The last point is also a great time saver. Simply pressing a button opens up a new Outlook email with pre-populated content. This reduces number of copy-paste errors. Here how it works in practice:
Data input
Pre-populated email
Here is VBA for those who are interested in
Private Sub btnSendEmail_Click()
On Error GoTo ErrorHandler
    Dim EmailTo As String

    EmailTo = Me.Parent.Names("EmailTo").RefersToRange.Value
    Dim EmailSubject As String

    EmailSubject = Me.Parent.Names("EmailSubject").RefersToRange.Value
    Dim EmailBody As Range

    Set EmailBody = Me.Parent.Names("EmailBody").RefersToRange
    SendEmail EmailBody, EmailTo, EmailSubject
    Exit Sub

ErrorHandler:
    MsgBox "Got Error: " & Err.Description, vbExclamation
End Sub

Private Function SendEmail(rng As Range, eTo As String, eSubject As String)
    Dim htmlContent As String, i As Long, j As Long
    htmlContent = "<table>"

    For i = 1 To rng.Rows.Count
        htmlContent = htmlContent & "<tr>"
        For j = 1 To rng.Columns.Count
            htmlContent = htmlContent & "<td>" & rng.Cells(i, j).Value & "</td>"
        Next
        htmlContent = htmlContent & "</tr>"
    Next
    htmlContent = htmlContent & "</table>"

    Dim OutApp As Object, OutMail As Object
    Set OutApp = CreateObject("Outlook.Application")
    Set OutMail = OutApp.CreateItem(0)

    With OutMail
        .To = eTo
        .Subject = eSubject
        .HTMLBody = htmlContent
        .Display
    End With
End Function
Happy New Year 2021 !
Posted: 2020-12-31
