Scenario analysis for Natural Gas options
Posted: 2023-11-12

Using Excel for decision making again!
When trading or pricing options, there is always a dilemma what would be best structure for given assumed market scenario. Here are some of the choices: - type of structure: put, call, calendar spread, fence, collar, condor, 1x2, etc - strike - maturity - entry / exit slippage - execution and brokerage costs
A seasoned investor would have a good intuitive approach which structure would create most of opportunities with minimal risk, but how do you gain such knowledge?
One way to do it is to use Excel and Data Table functionality for scenario analysis. Data Table can easily run 2 dimensional scenarios which are the most common for options: What would be the option price for a given futures price and time to expiry.
In this post we’re going to analyse a simple Natural Gas Call against January 2021 contract. We’re using Black model, however the Data Table also works for advanced models. As usual, Excel worksheet is here.
The following picture shows option pricer parameters. Additionally there is a matrix showing option prices for given market move on given day.
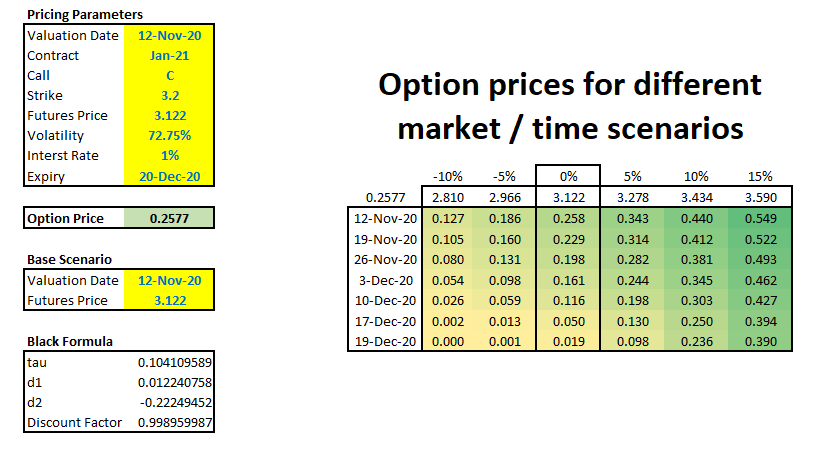
As the time progresses our call option looses time value, however if market goes up we can see sudden value increases. For example if we bought this option on 19 Dec 2020 (a day before expiry) for USD 0.019, a 5% move up in the market would value this option at USD 0.098 - an increase of more than 5 times! This is a phenomenal leverage, but trade-off is that our investment would be worthless next day.
Here’s the chart showing how time value decays as time progresses for different scenarios. For out of the money options as they are nearer the expiry their value becomes 0. On the other hand, the in the money options converge to their intrinsic value.
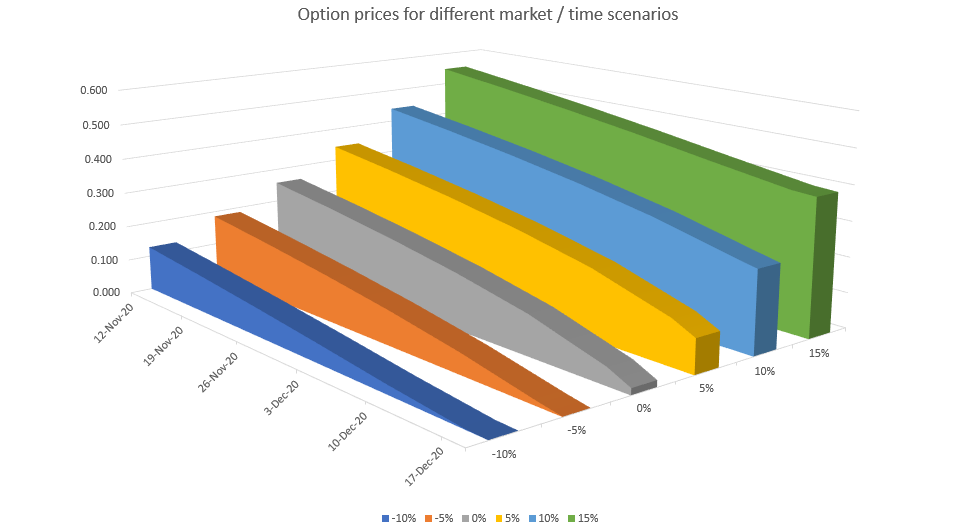
Photo by Alexander Schimmeck on Unsplash