Taking chances in Monte Carlo
Posted: 2023-10-29

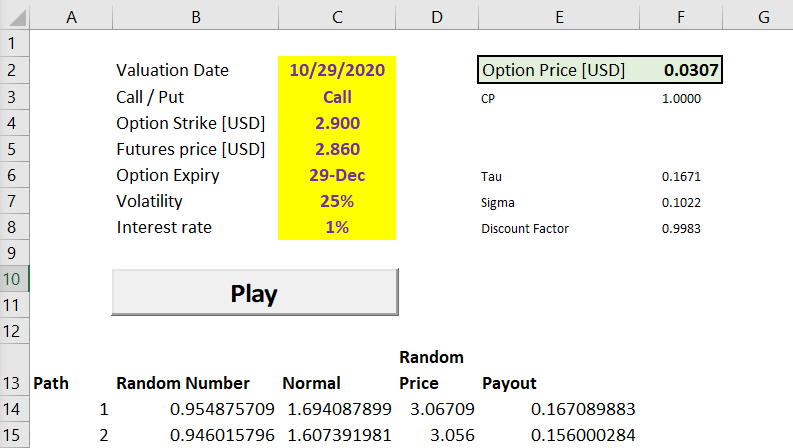
One of the cool ways to learn few tricks with Excel is to use it as a Monte-Carlo simulator to price options. For simple options like the ones traded against Nymex Henry Hub futures, there are closed form formulas available, however where’s fun there?
Basic Monte Carlo algorithm is actually quite simple: - we are going to throw a computer dice using Excel function Rand, this way we get a number from 0 to 1. This will be our “probability” - then we will use function Norm.s.inv to convert this probability into a draw from a normal distribution - next we calculate futures price at option expiry using this formula
$$ P = P_0 \cdot e^{( \frac {-\sigma^2 \cdot \tau} 2 + \sigma \sqrt \tau {dw})} $$ , where: $P_0$ is current futures price, $\sigma$ is volatility, $\tau$ is time fraction i.e. $\frac {expiry - today} {365}$, and $dw$ is normal draw from above
All the parameters required to price options are conveniently specified in worksheet’s panel. Details, as usual, in the attached Excel spreadsheet.

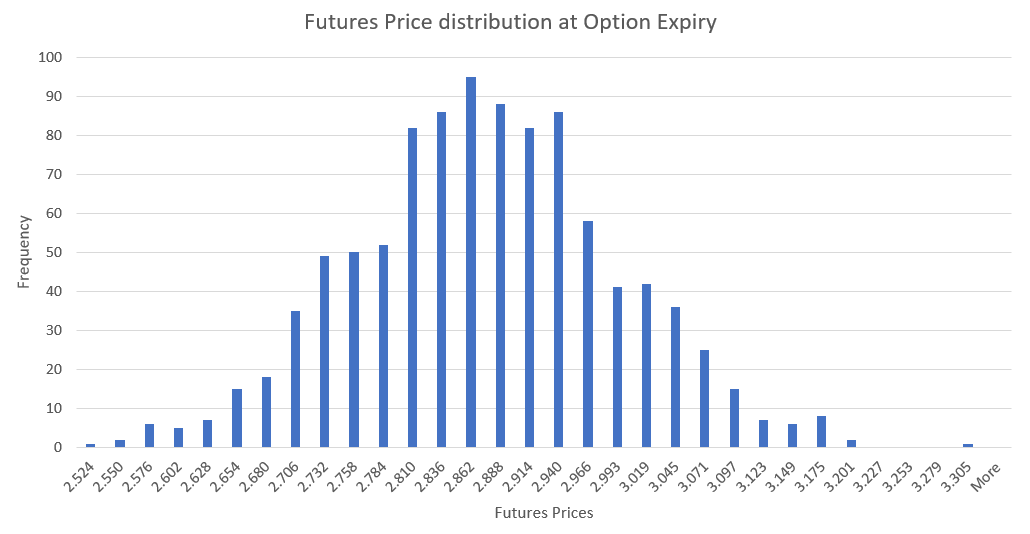
To finally calculate option fair value price, all we have to do is to average simulated option payouts. This chart shows distribution of generated futures prices.

Pricing exchange traded options using Monte Carlo is an over-kill, however Excel worksheets can be used to generate required scenarios to price more complicated instruments like storage contracts or transport rights. Stay tuned.
Photo by Heather Gill on Unsplash